


Are We There Yet? - Mar. 10, 2025
My Journal

Paid Subscribers: You have full access to Bender, the Pullback Indicator, at any time at machinaquanta.com. Just login with your email you used for substack. There is an educational video and example graphs on how to use the tool to assist your decision making (the latter is available even for free subscribers). Please reach out to me if you have issues using it.

Mon. Mar 10
Since market open on Friday (Mar. 7) Bender has been signalling a pullback. The signal was given when the model out (blue line) decreased, which led to the initial selloff on Friday am but the signal didn’t recover by end of day. That should have been my first clue that something was off. Then, Monday morning Bender flatlined (didn’t recover), another worrying sign especially as we gapped down on open. My thinking was that the signal, although calling for pullback, couldn’t have been that strong. could it?
Looking back at similar patterns historically, the most violent selloffs I’ve witnessed lately from this model have been linked with this indicator flatlining. If you are not convinced, go to machinaquanta.com and look at Dec. 16 onwards for those next 5-7 days and convince yourself. While EVERYONE was expecting a Santa Clause rally (I fell victim to this bias too btw), Bender was screaming sell and we know what happened Dec. 18 at FOMC. Bender can give false signals, absolutely, it is not perfect but it can find things that nobody expects…and it misses things too. It’s just a tool, like a calculator.

Reminders and lessons learned:
Follow Bender’s instructions! Bender says down and we go down, don’t be cute trying to time a bottom. You’ll end up with egg on your face like I have - I have biases too.
Small decreases in indicator may or may not result in large selloff in SPX.
Large decreases in indicator most usually result in large selloff in SPX.
Flat line in indicator (after decrease) most usually result in violent selloff in SPX.
So back to the topic today, are we there yet? No idea, but I’m looking for some clues in price action to give me some probabilistic edge (more below on that).
VIX
We are finally starting to see more movement in VIX which more closely resembles price action. So far, selling was very controlled, you don’t find a bottom when selling is so controlled. Controlled selling means that there are still too many hedges in the system. However, based on today’s price action and VIX, the selling does appear on the more excessive end. Is this capitulation? It’s one marker of it but VIX can go quite high. A lower high on VIX would be telling of that, just something to look for.

Defensives vs Tech
Seeing price action in defensive sectors vs high beta like tech really does show the flight to safety. If we are to see any sign of rotation back into tech, you’d want to see these defensives start to perform poorly again. Just something to watch for.

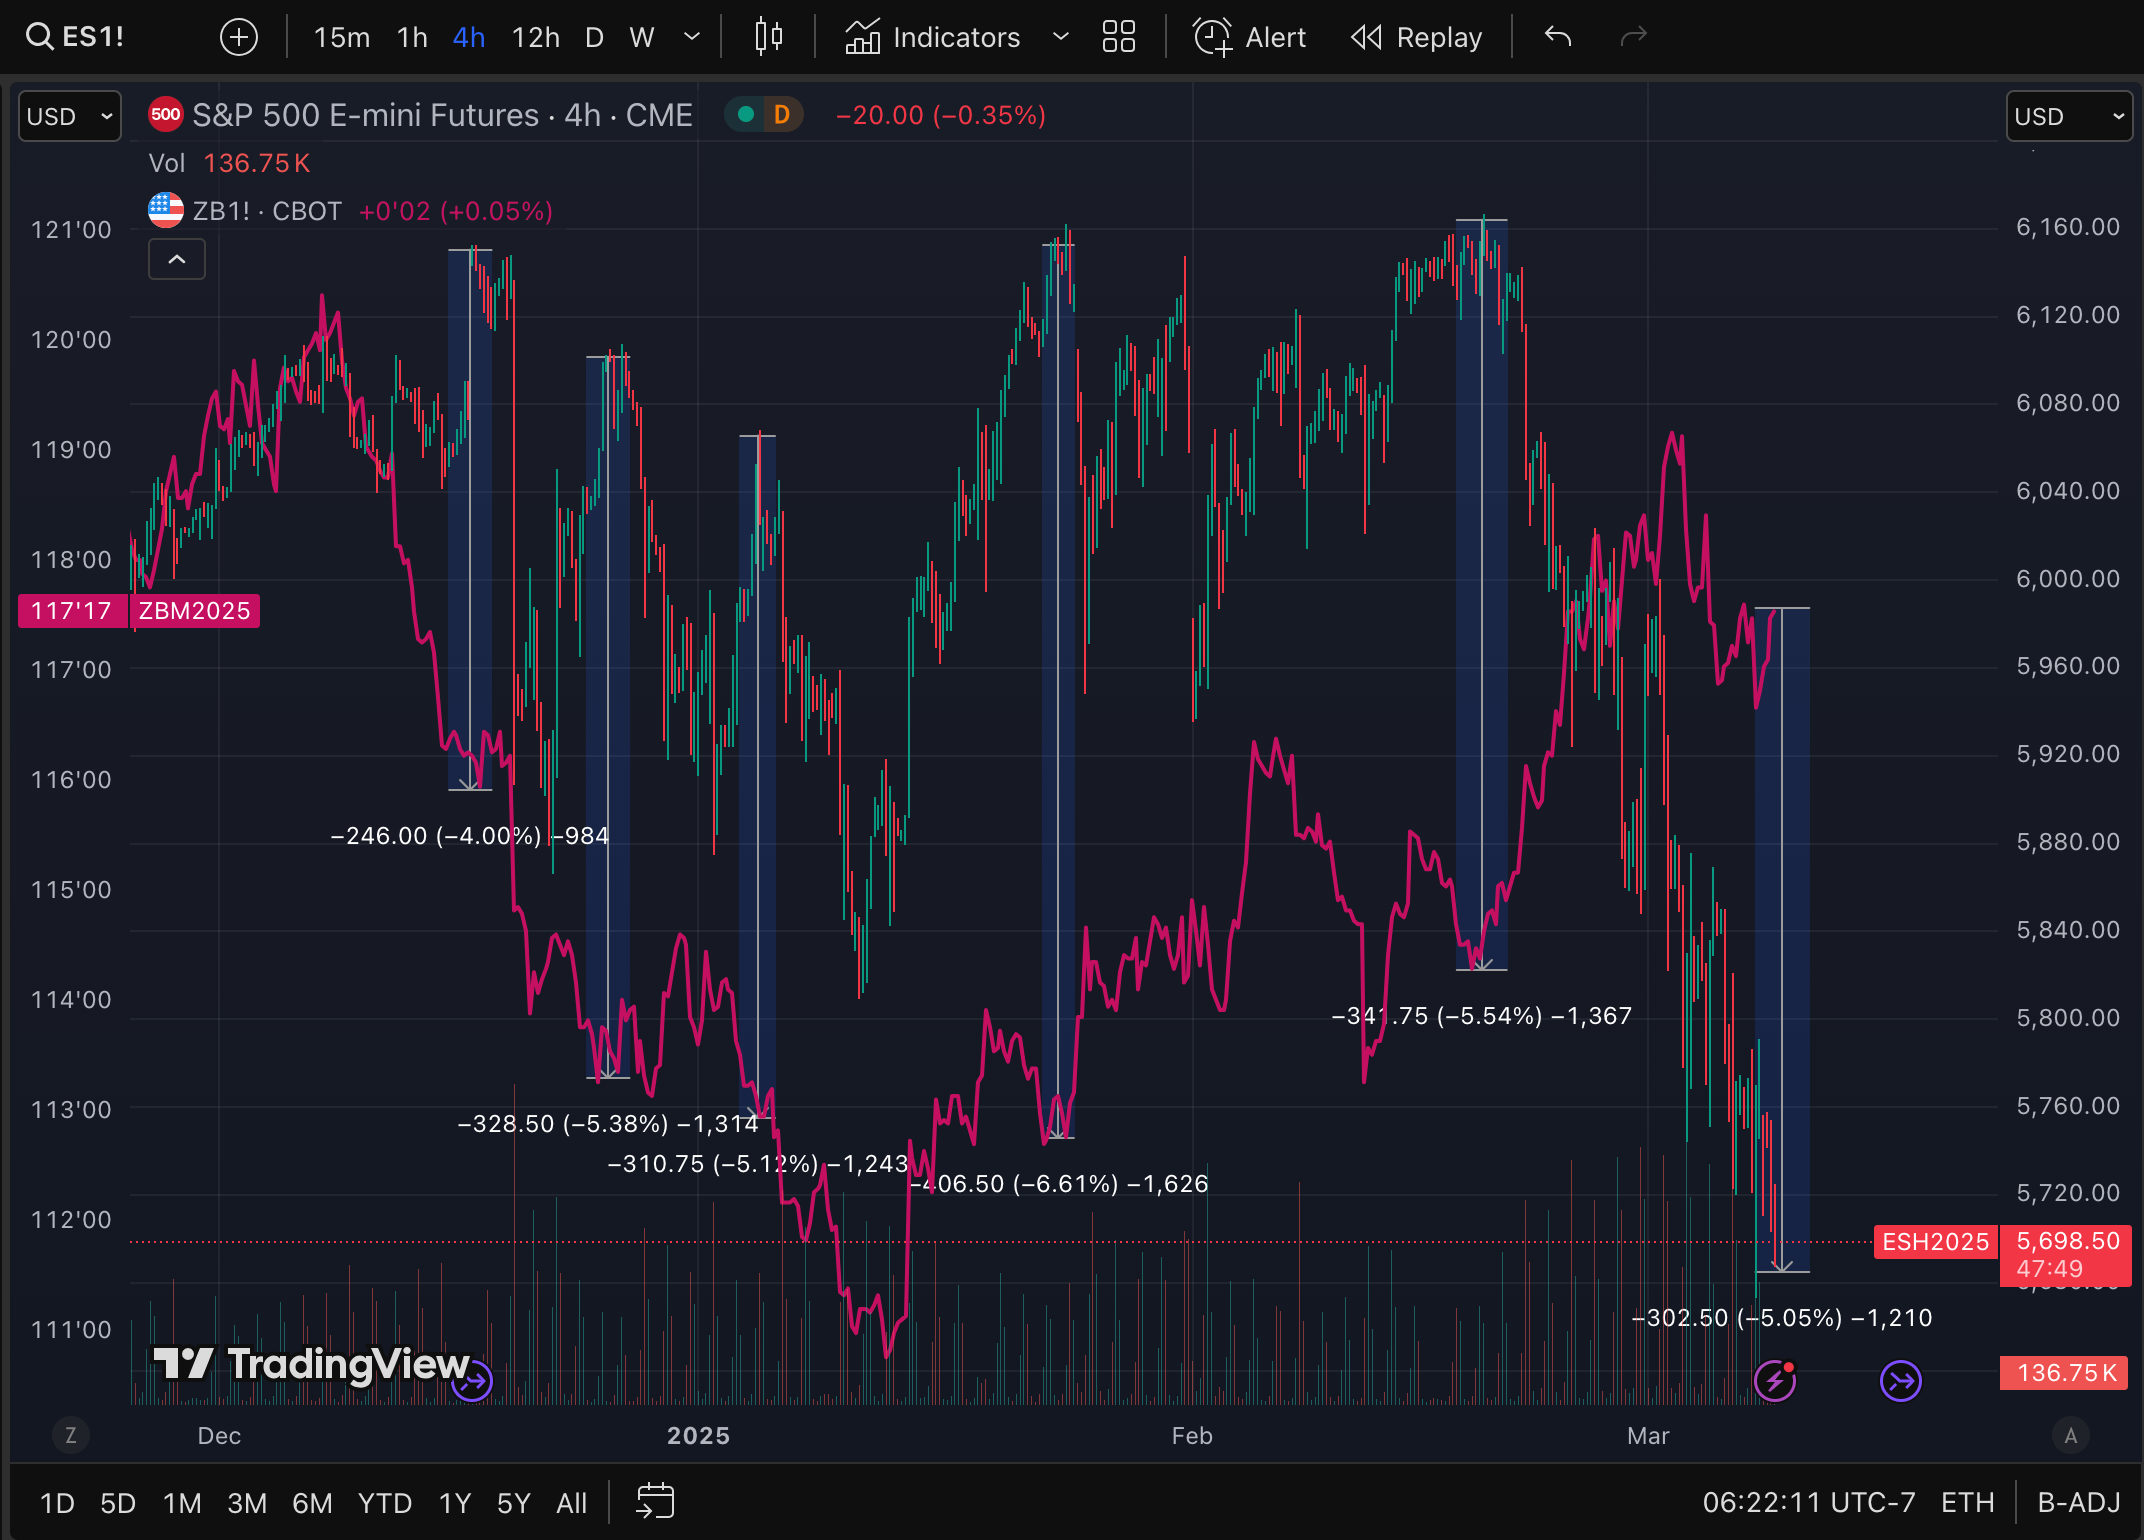
SP500 vs US Treasuries
I’ve shown you this chart before. This is the imaginary ‘spread’ between ES futures and bond futures. Sometimes they are coupled, more recently they have diverged. I was expecting this to compress again but it hasn’t. The fact that it hasn’t also led me to sell my TLT hedges early last week on the pop. For those using TLT or bonds as a hedge, as you can see, it has not been helping you much as this spread is just not compressing. Bonds will do well in a true recession or during financial crisis.
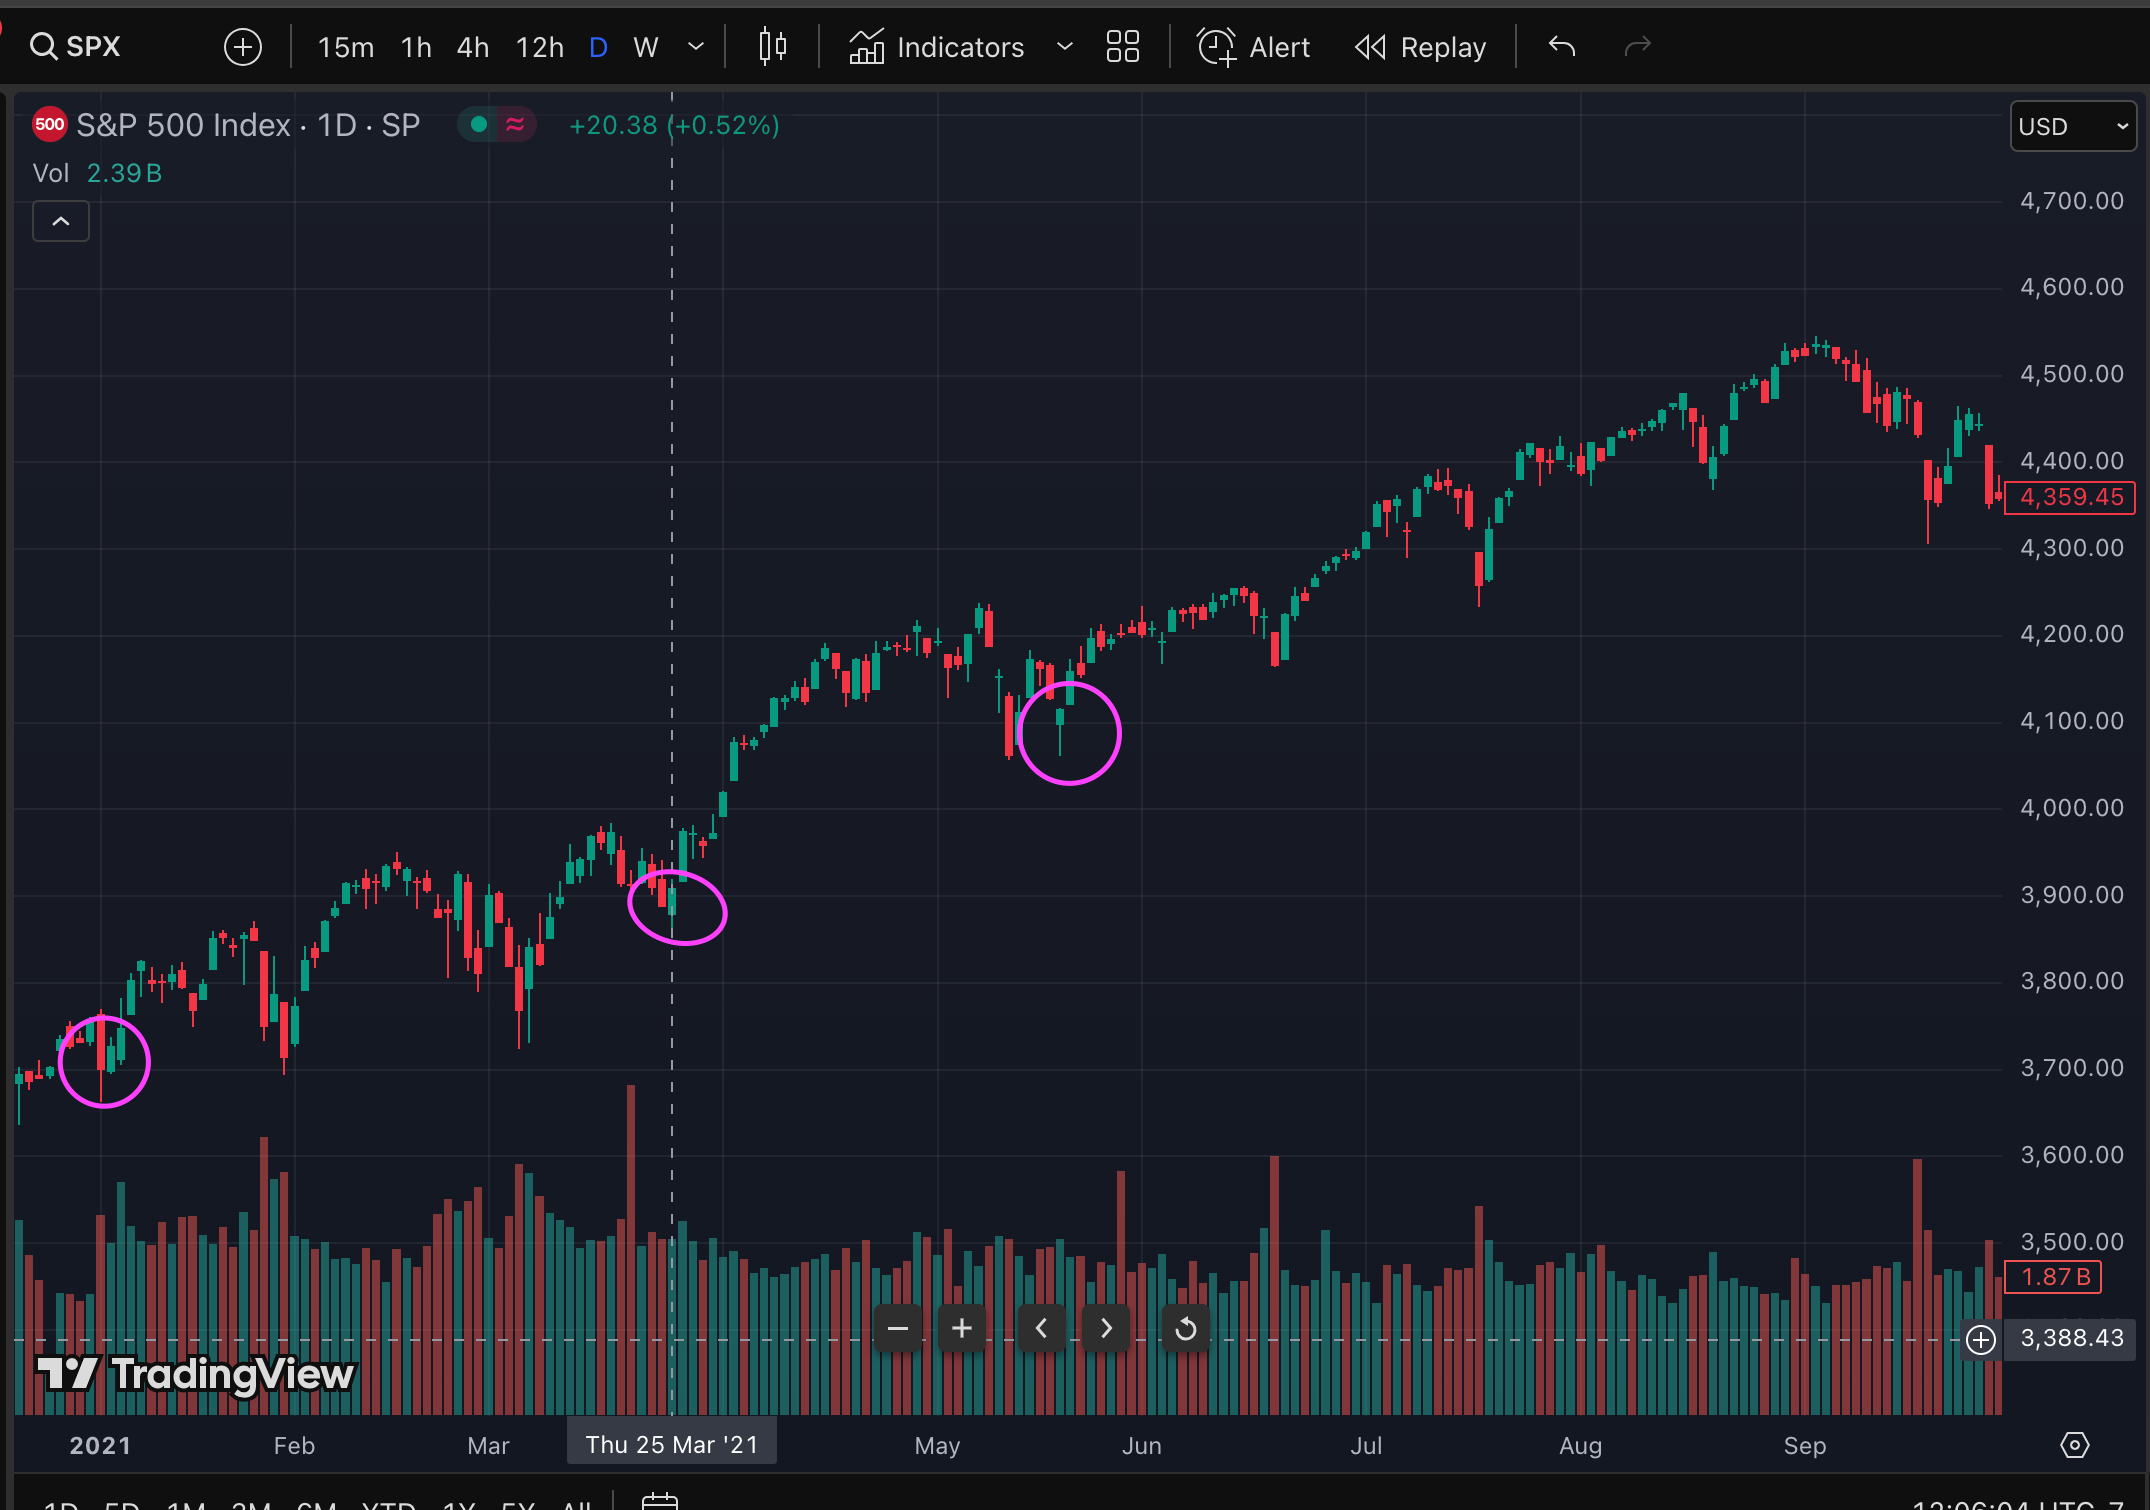
What Have Recent Bottoms Looked Like
In no particular order I’ve collected some price action behaviour around bottoms (local and otherwise longer term) to look for patterns. Notice anything peculiar? Gap down open then a red to green candle. In other words, we exhaust buyers with panic as they are trapped from overnight sellers and finally buyers step in as weak hands have closed out their longs. Keep an eye if you see this pattern emerge - it will help your conviction during times of chaos.


What’s Next
Bender at end of Monday shows…
Keep reading with a 7-day free trial
Subscribe to Machina Quanta to keep reading this post and get 7 days of free access to the full post archives.