


He Tariffs Me, He Tariffs Me Not - Mar. 27, 2025
My Journal

machinaquanta.com ← analytics site & education for subscribers (reach out to me if you want access)
Every physical object has entropy, and entropy must always increase, per the second law of thermodynamics.
Wed. Mar. 26
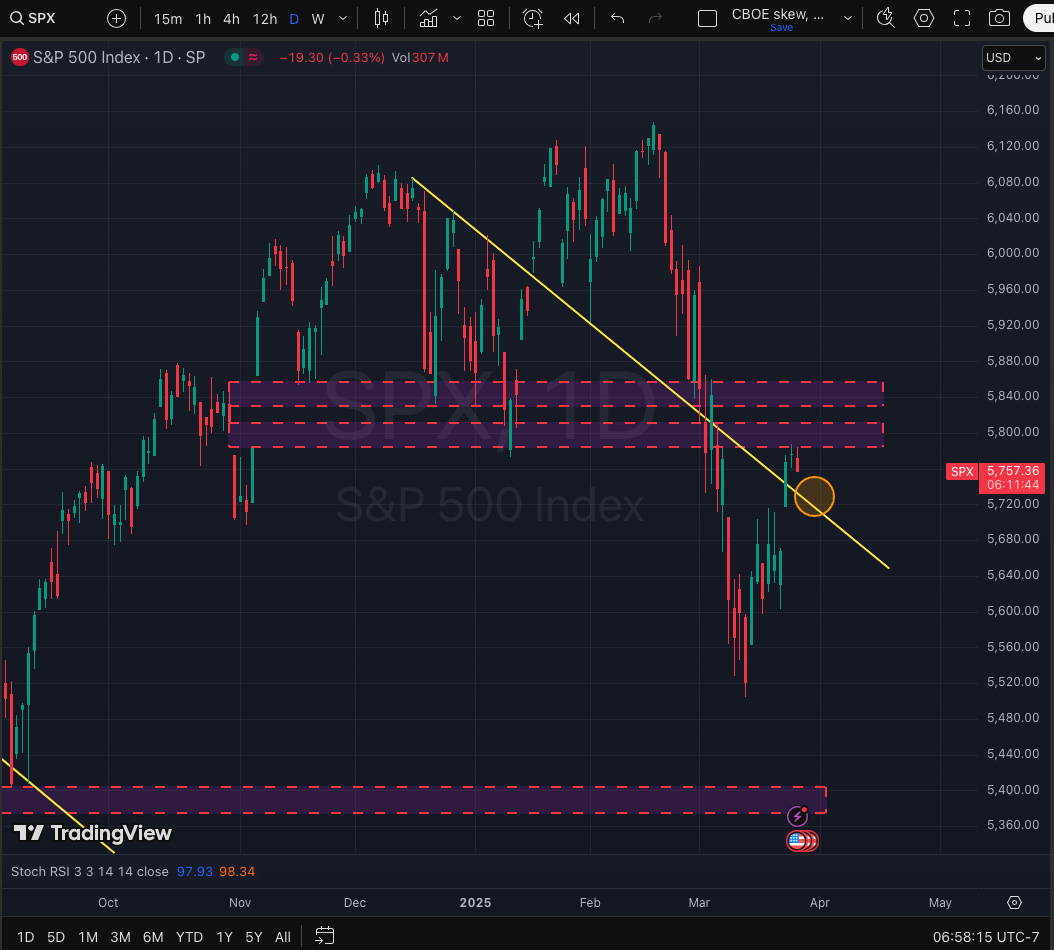
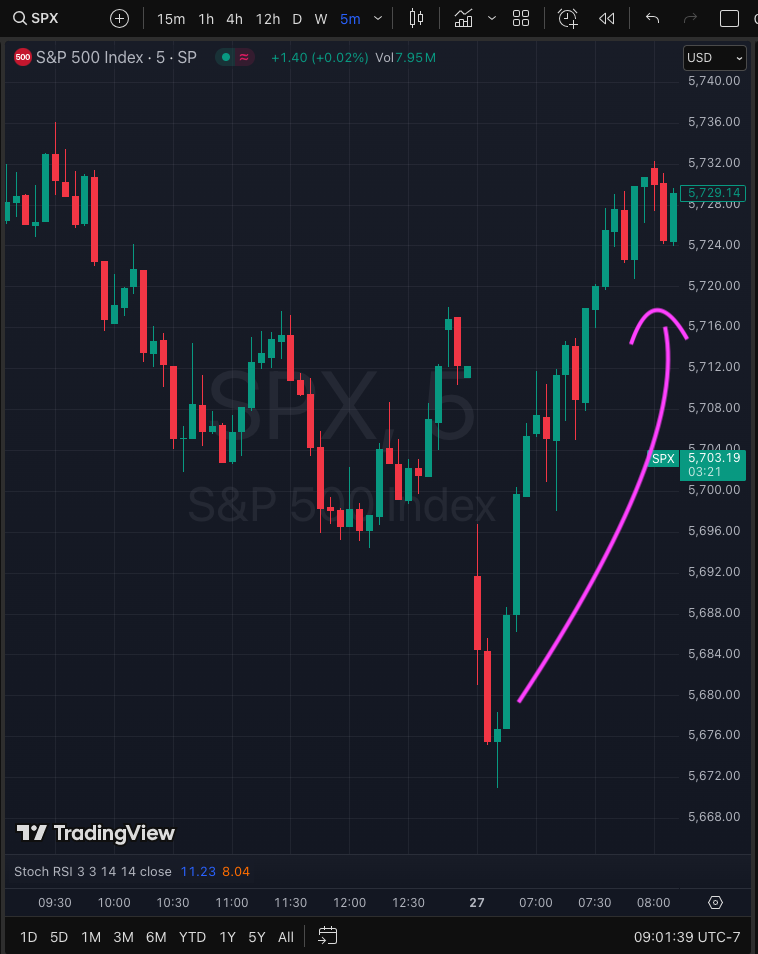
Wednesday can be summarized by three images. First one is zoomed out SPX with some technical levels I pointed out - you’ve seen me post this chart a few times now, it doesn’t change much lately. Remember our first box where I said to expect resistance/pullback (~5775-5810)? Well, we hit it quite precisely.
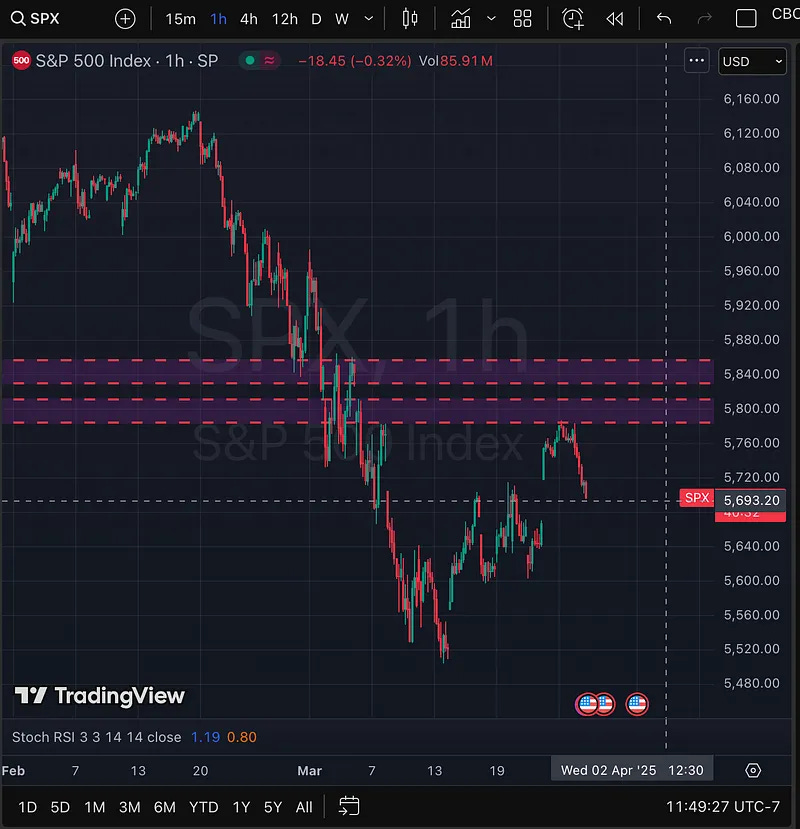
Below is the zoomed in version to show the precision of price action at this box. Price wicked up just barely into our resistance box before reversing. And boy did it reverse.
Our main model gave the sell ‘signal’ first thing in the morning. Thus, we had a few (not all) confluence factors lining up, you know what that’s called? Edge. More details below.

However, there was still one thing bothering me though. I wrote in the morning chat:
My preferred setup, as you know, for shorting would be ramp up into close and the model signals sell. I want as many longs trapped as I can - euphoria if you will. We are at the resistance I mentioned, model is starting to point down, GEX has elevated again to a reasonable level to short (although I don't see the divergence I'm looking for). BUT this euphoric buying I feel is missing which is the part that is getting to me. In every other aspect it feels like a layup short. Can it really be that easy here?
Yes. The answer is yes. It turns out it IS just THAT easy.
Honestly, I am floored that this short was this obvious. It was so obvious that I didn’t take it ha! I thought no way market makers would let this one fall so easily and instead trap shorts to rip it back up. I had anticipated to short closer to the second upper box. In hindsight, after scouring Fintwit, I started to realize that many other traders were also waiting for a similar upper box to short (~5820), which means only one thing - it won’t happen, not the way I thought anyways. The lesson here is: 1) find edge (we did) and 2) take the shot anyways, with a small small portion of the folio.
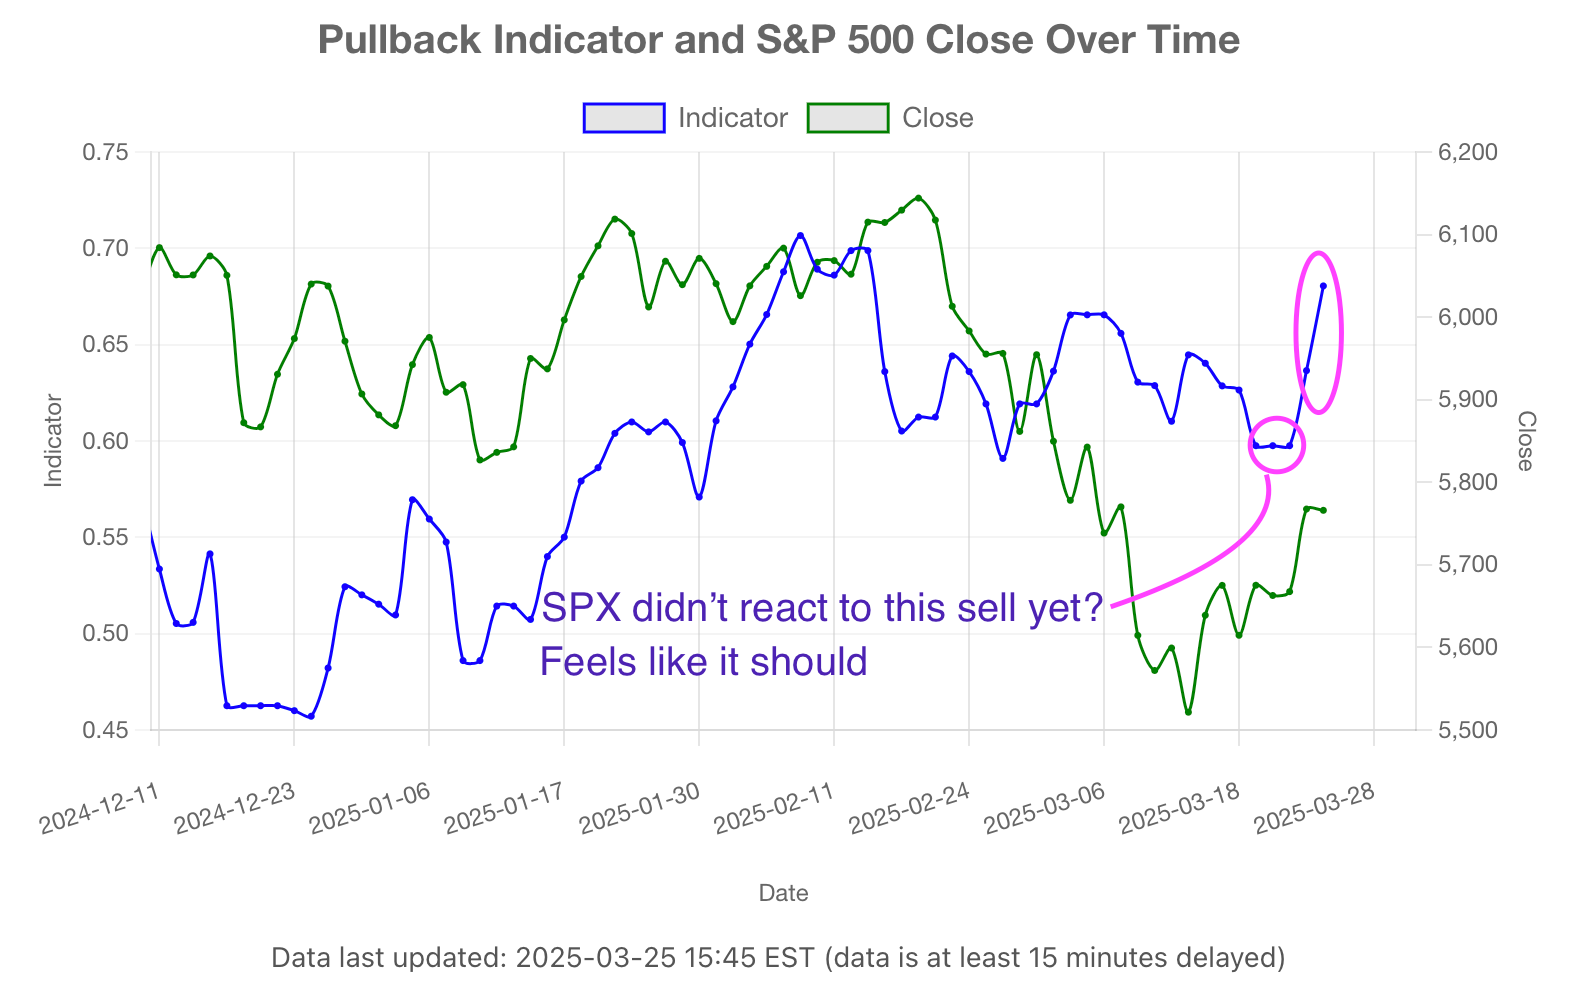
One thing I didn’t cover yet. Why did the pullback feel so outsized - from a quant perspective, not from macro. Remember, the graph below I posted on Tuesday? I had a very anxious feeling that SPX still had not ‘reacted’ to the ominous flatline that our model triggered only 2 days prior - I said so in the image the day BEFORE we sold off. Flatlines in the output can lead to violent pullbacks. So, the flatline ‘signal’ that triggered only a few days ago, and the model ‘signalling’ for sell on Wednesday I feel exacerbated the pullback.
“The signal catches up to the SPX” is what I like to say.
Thrs. Mar. 27
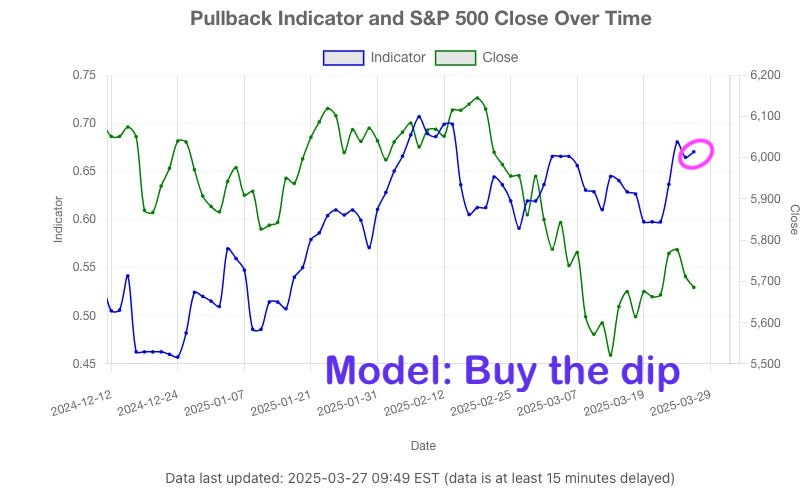
Thursday was watching paint dry. I think that sums up the day for almost everyone. The main model showed stabilization (or buy the dip) first thing in the morning despite the gap down and sell off. You can see the results below. After that, the rest of the day was nonsense as we just ended up flat.
I try not to day trade with the model but you can start to see patterns from the output. When SPX does the opposite of the model output, it is worth paying attention to cause there could be a trade.
Important: reminder that I use the entropic model almost exclusively to find pullbacks and corrections (that is why I created it), not for finding when equities rally. Remember, equities should normally go up and to the right on their own - that is the natural course. Yes, there are some unique cases where it can tell us to buy (Mar. 13 I did use it that way to find the bottom) and recently found patterns where gap ups are likely to happen. Just keep that in mind, stabilization does not mean we slam up.
In the meantime please find the education section at machinaquanta.com and help provide any feedback on what you’d like to see more/less of.
Recession Teaser
I would like to do a piece on recessions for you nice readers and specifically the comparison to 2022 as I am hearing a lot that 2022 is happening again. Until then this is the start of the teaser.
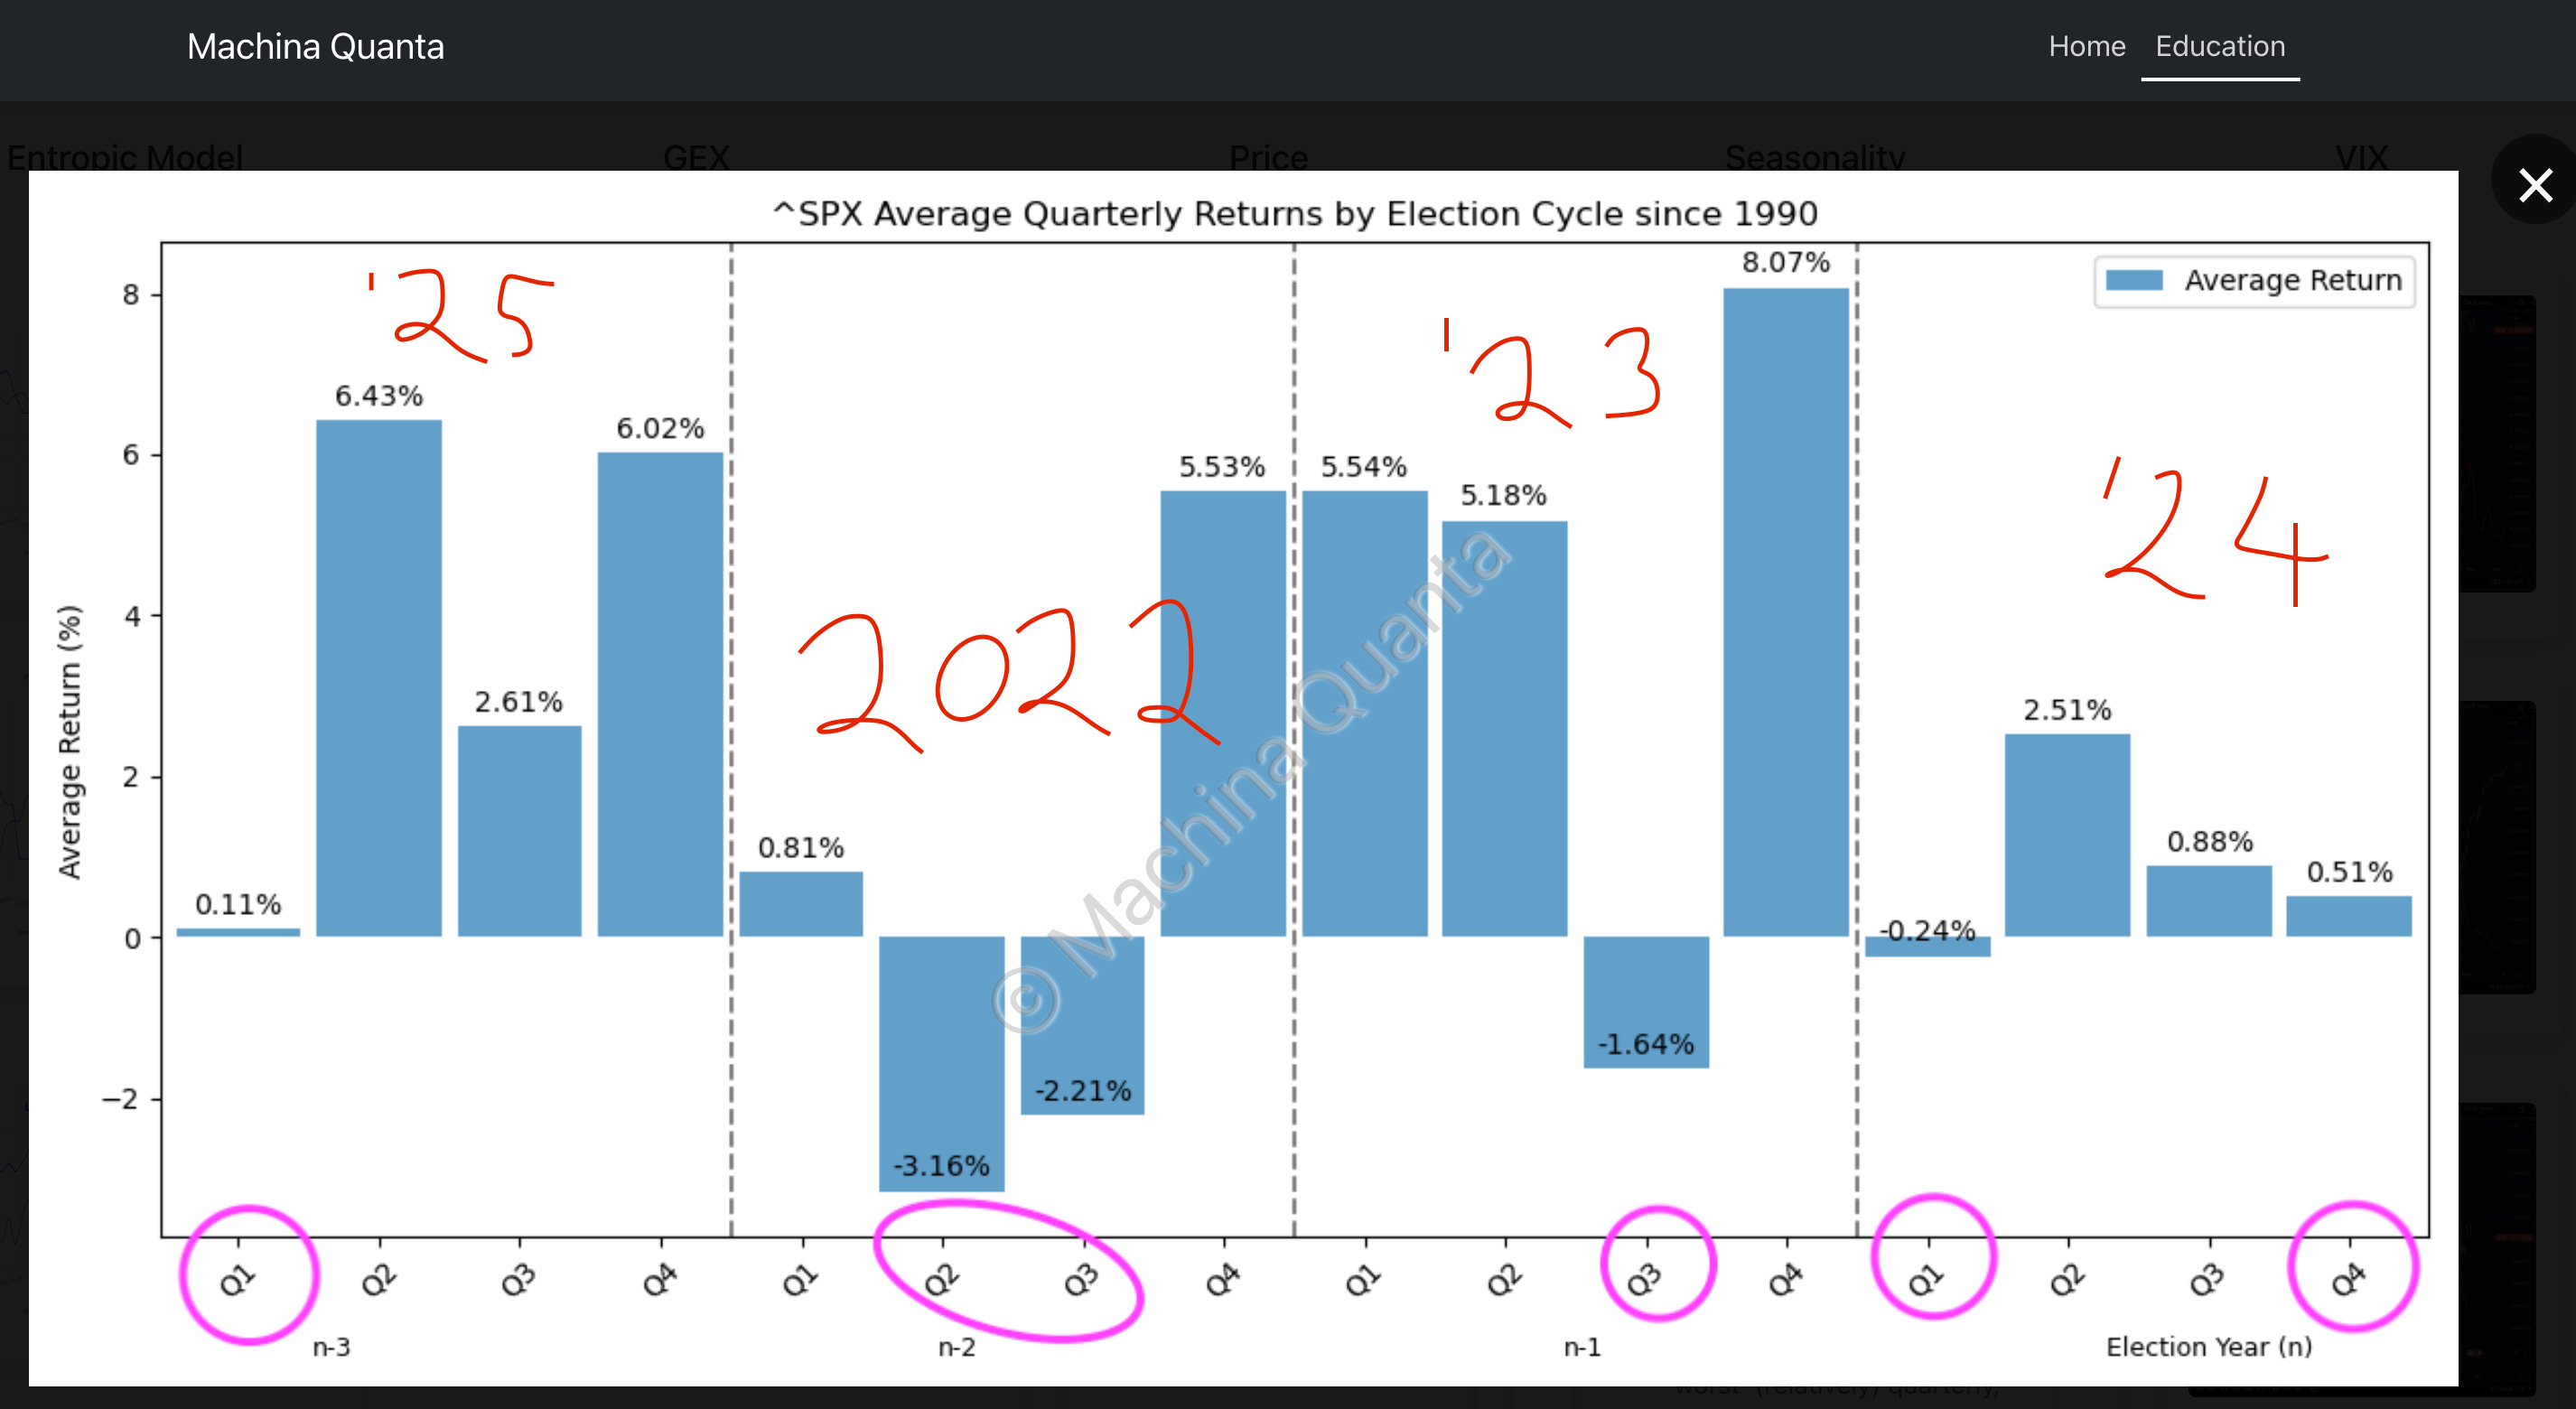
Below is the quarterly seasonality from our site based on presidential election year, you might have seen something similar. To make it easier to understand the time periods (instead of n-3, n-2, etc.) I have labelled out some recent years and the hypothetical 2025 is on the left quadrant. Q2 (hypothetical 2025) following an election year is not bearish. In fact, it is the second strongest quarter in the entire presidential cycle on average. Now it is NOT a guarantee that it happens this way of course but remember how you find edge. You look for a confluence of factors. Do you REALLY want to go shorting in the 2nd strongest quarter of a four year period? Now look at 2022. It was the 2nd year (n-2) following a presidential election. Notice the abysmal returns. Now I also admit the sample size here only goes back to 1990 so that’s statistically very small.
For paid subscribers I will show you next time what 2022 looked like from an entropic perspective. I think having that perspective is hopefully worth the tuition to this publication as you will know when it is coming. More to come.
What’s Next
Keep reading with a 7-day free trial
Subscribe to Machina Quanta to keep reading this post and get 7 days of free access to the full post archives.