


Weekly Alpha Review - May 9, 2025
My Journal

machinaquanta.com ← analytics website for subscribers.
“The signal catches up to the SPX” - Machina Quanta
Let’s do a review of where we are at in markets from our metrics. Similar to before I will assign a rating 1-5 for each metric. 1-very bearish, 3-neutral, 5-very bullish.
Entropic Model
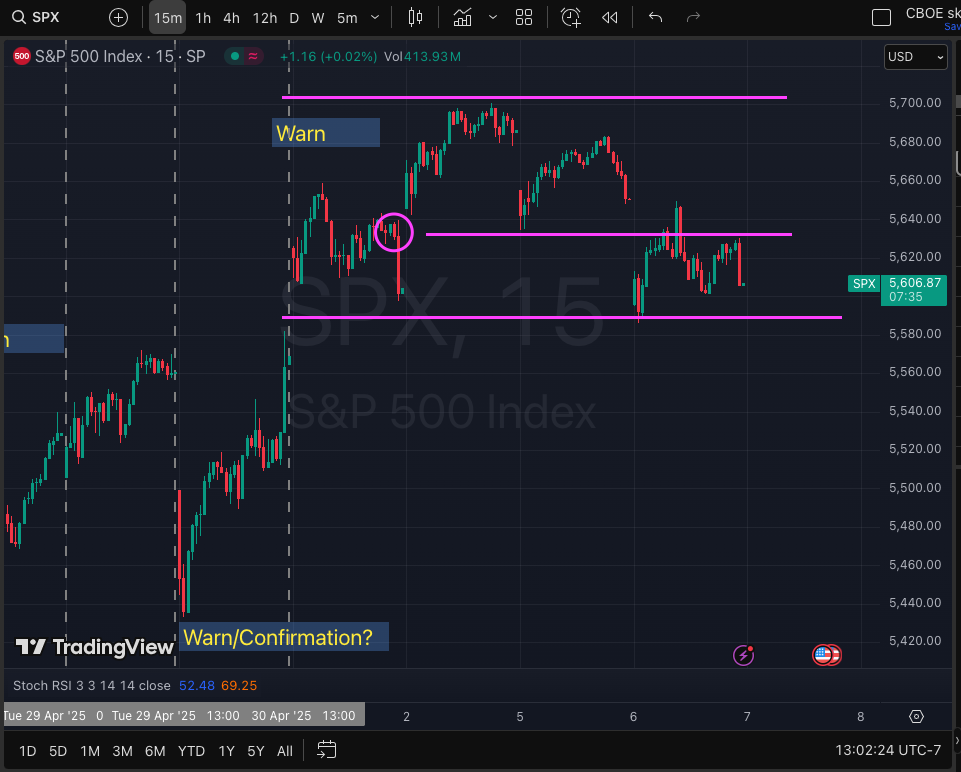
The quant model showed an anomaly on 04/30 which appears to have been triggered 3 days later in SPX on 05/05 and 05/06. SPX usually ‘reacts’ 0-3 days after a warning.
I attempted to hedge this anomaly, unfortunately, the SPX also climbed ~120 pts since this warning which made hedges largely ineffective. As well, some of these warnings had been reversed in after hours, right before we had gap ups the next day - a consequence of the headline driven market. Now my question is, where is the second sell? I’m not sure that anomaly has resolved itself. The impact is neutral/bearish - rating 2/5.

GEX
(Update May 11 - data provider had a data error)
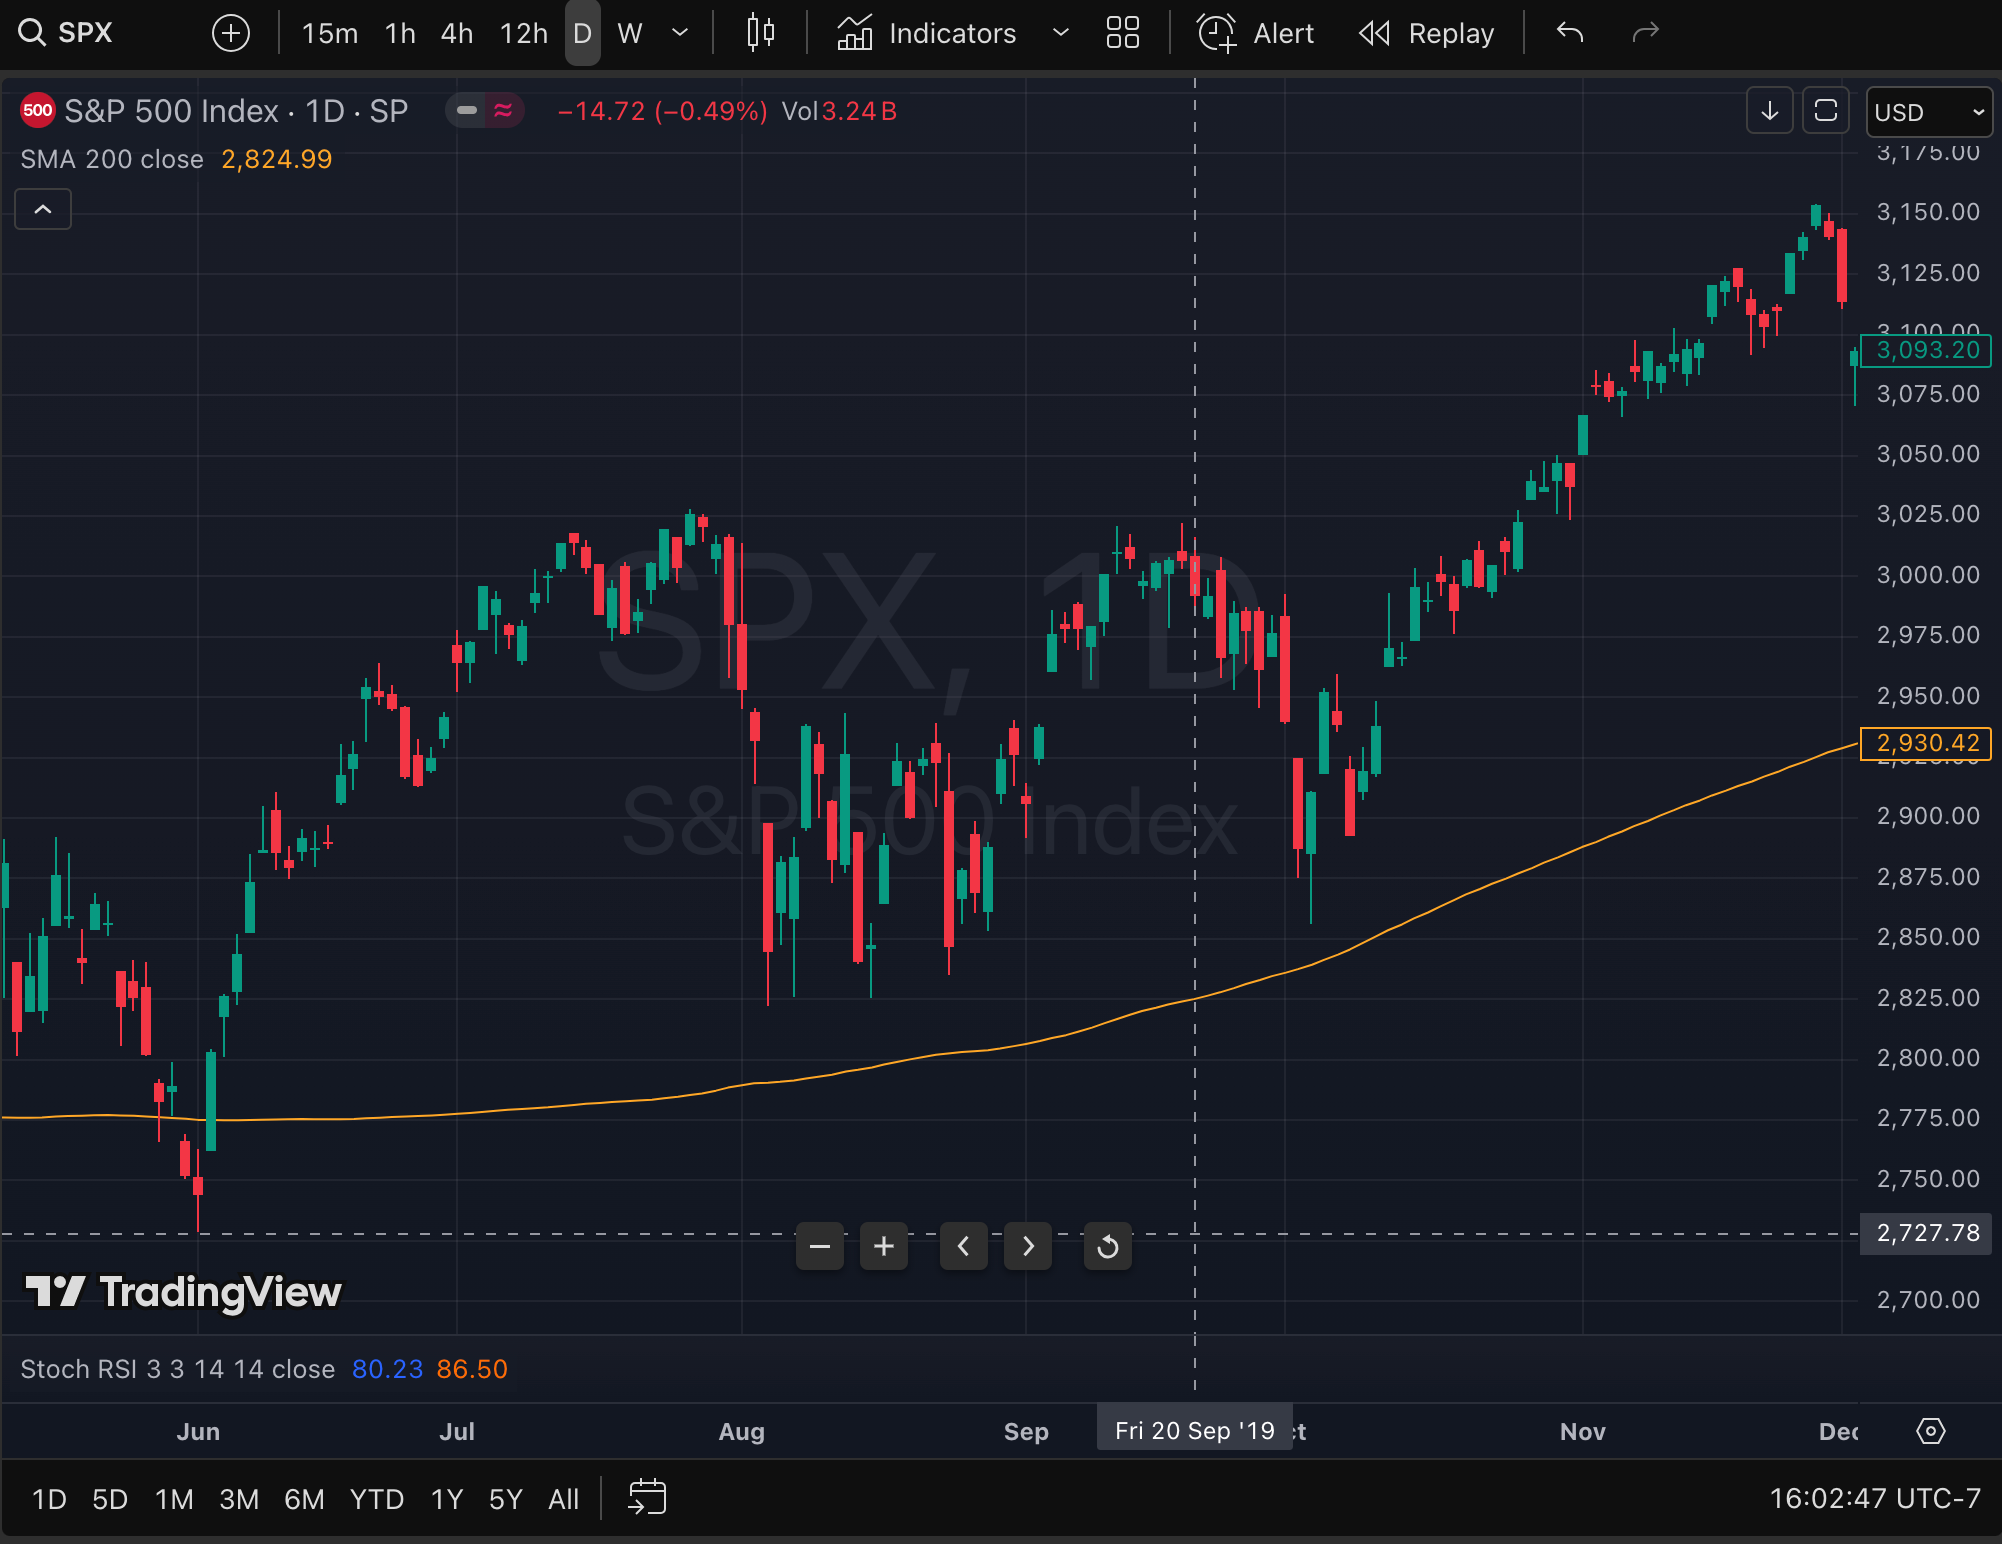
GEX (dealer gamma exposure) has continued trending up since 04/21. Other than 04/21 I haven’t noticed any actionable anomalies from GEX. On Friday, we saw some liquidity had been removed from the market. GEX dropped from over +$4.7B to +$3.7B meanwhile, the SP&500 was largely flat.

I found some dates for you below where I saw similar action, although, the magnitude is lower currently so, keep that in mind.
Sept. 2019
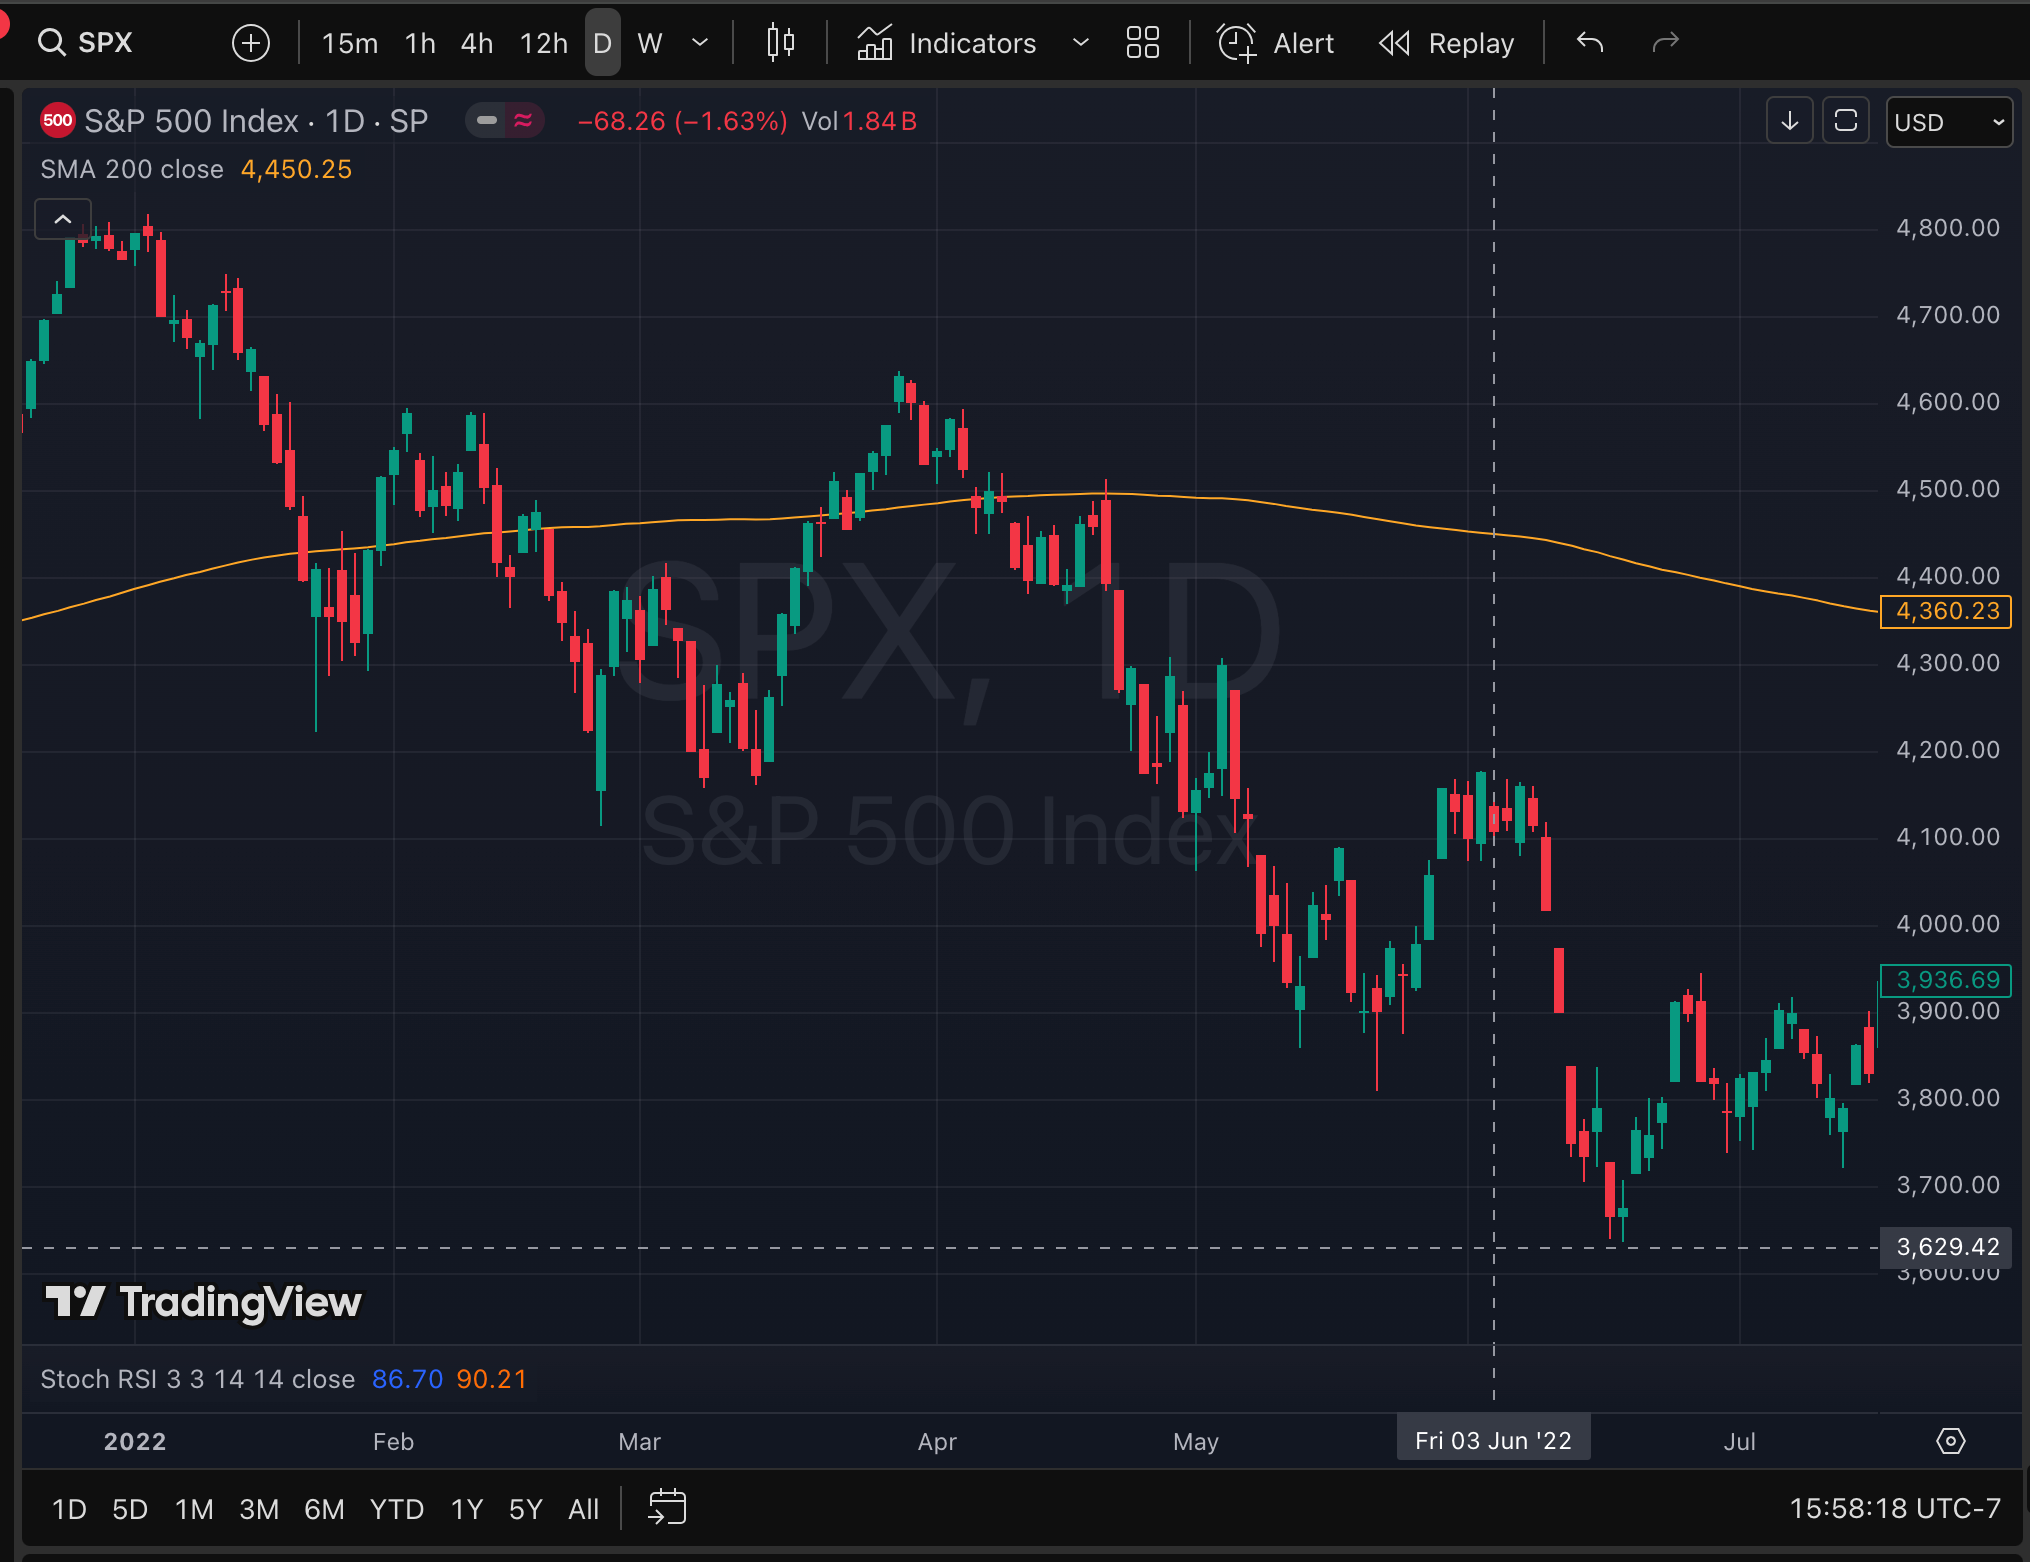
June 2022
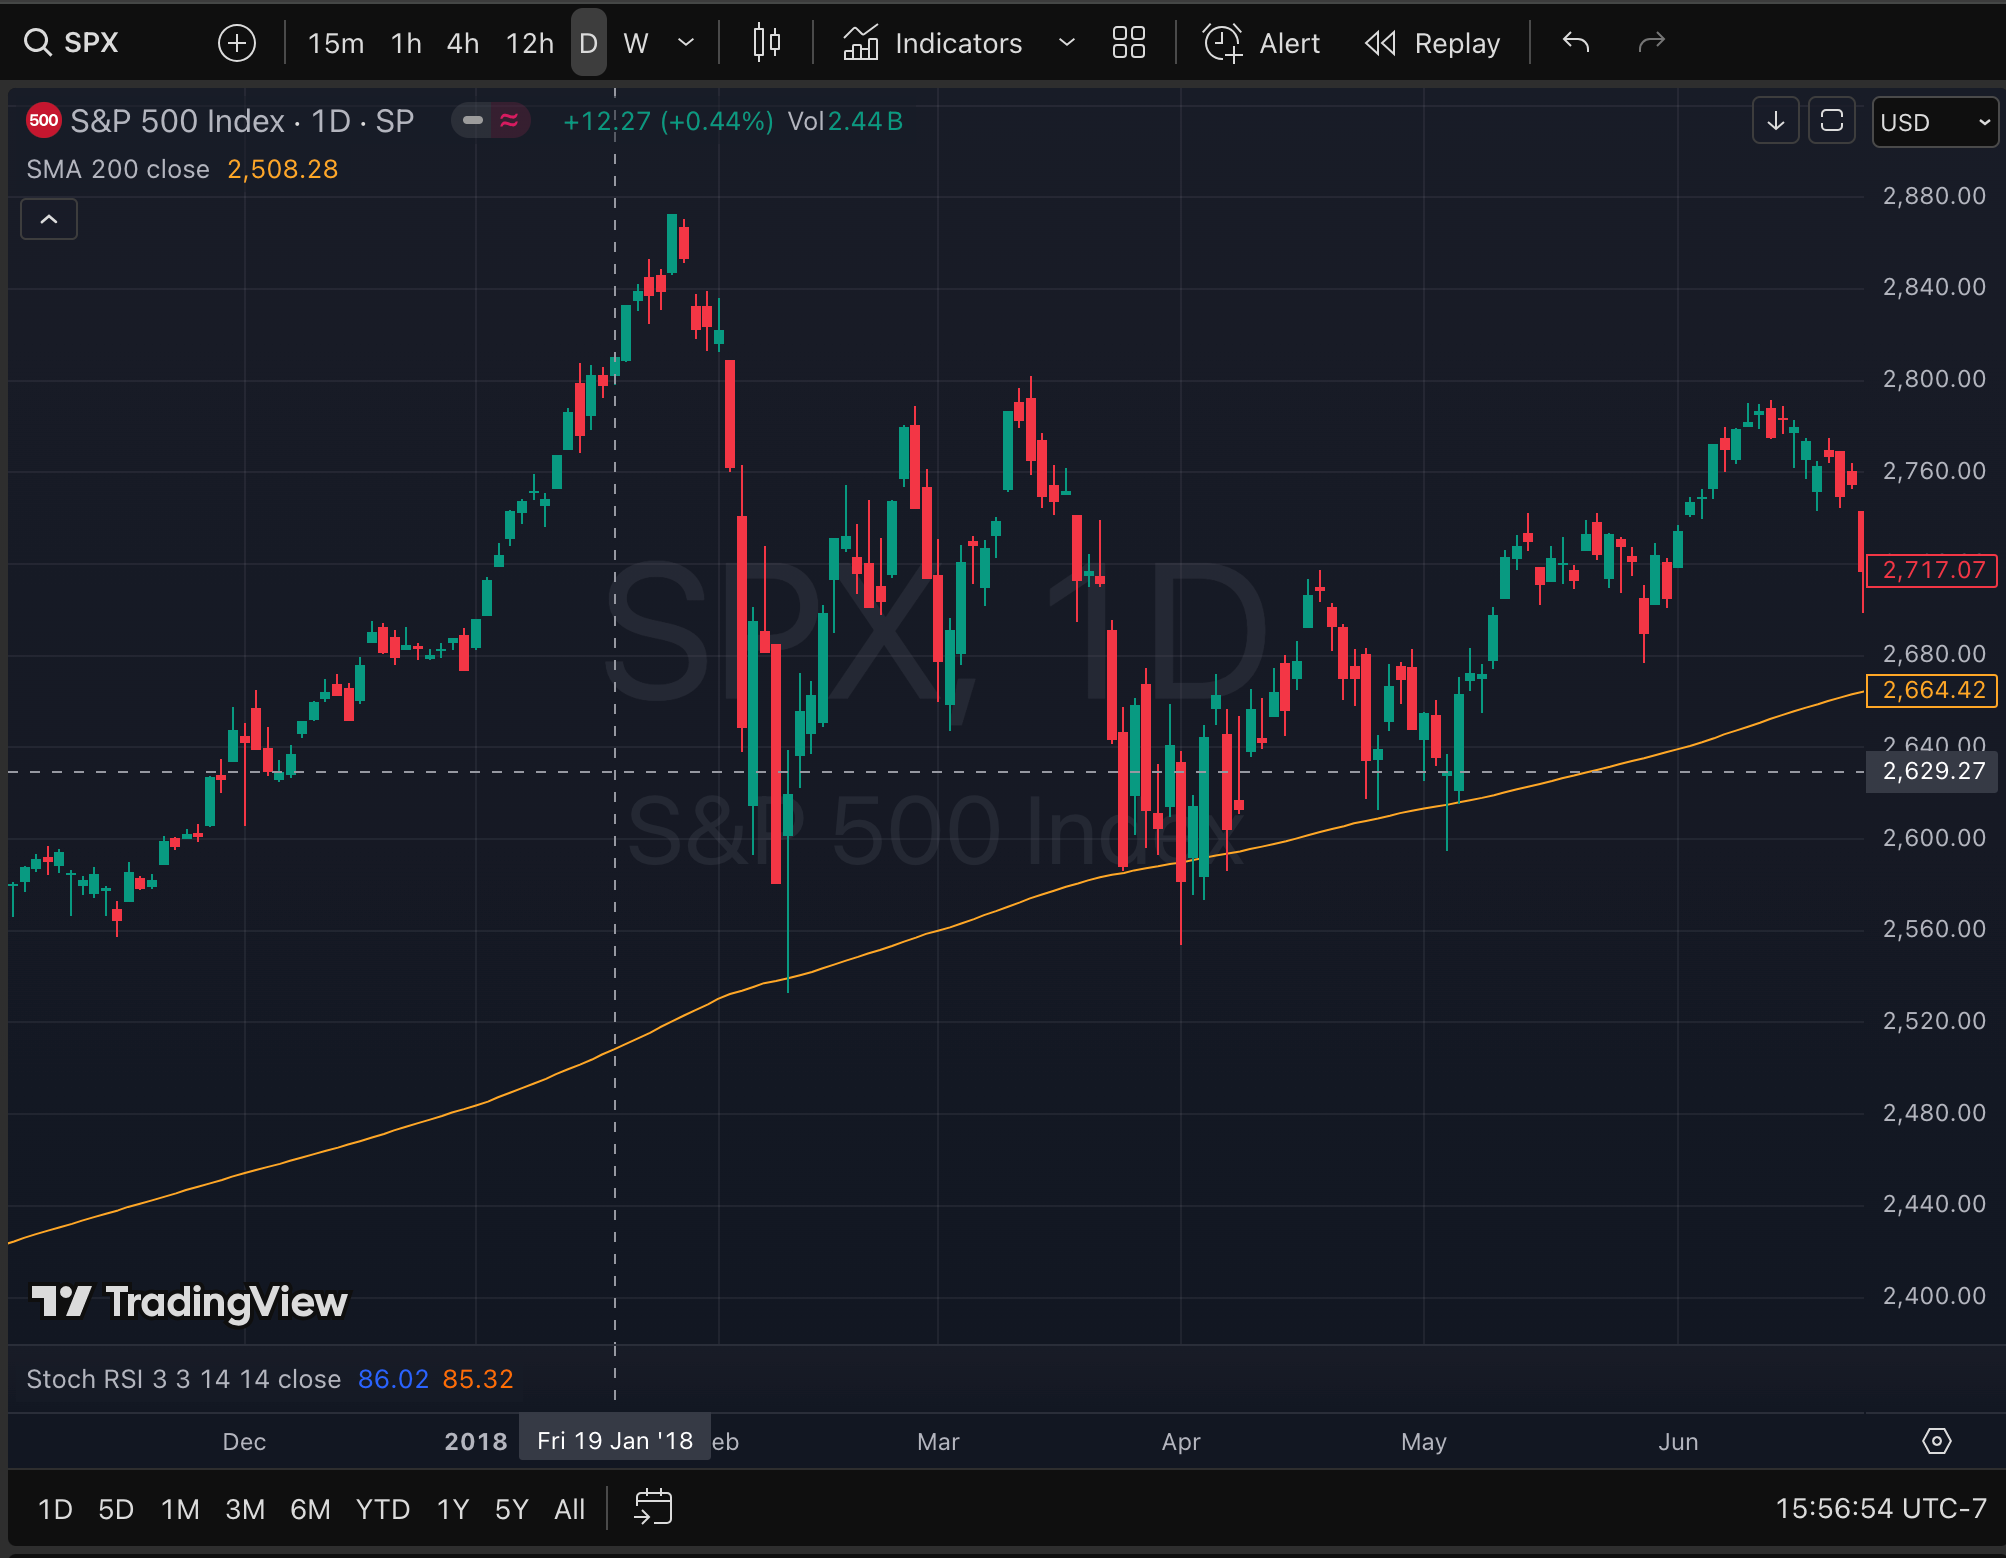
Jan. 2018
GEX is still at an area where the market is well supplied with liquidity (hence it supports BTD behaviour). However, the more liquidity that is removed from markets the larger the price swings. Impact from this is bearish - rating 2/5.
Seasonality
Historically, May is an ok month as you see below. June on the other hand is really hit or miss. On average it is 0% return which tells me some years June is fine for returns but there are many years (not quite half) where the return MUST be negative (if the average return is to be ~0%).

At the moment, May H1 is an ok time period (see below), followed by a bit of an uptick in May H2. June is where the returns seem to struggle. The impact: May is neutral - rating 3/5; June is neutral/bearish - rating 2.5/5. Note, returns from future months can be pulled forward.

SKEW
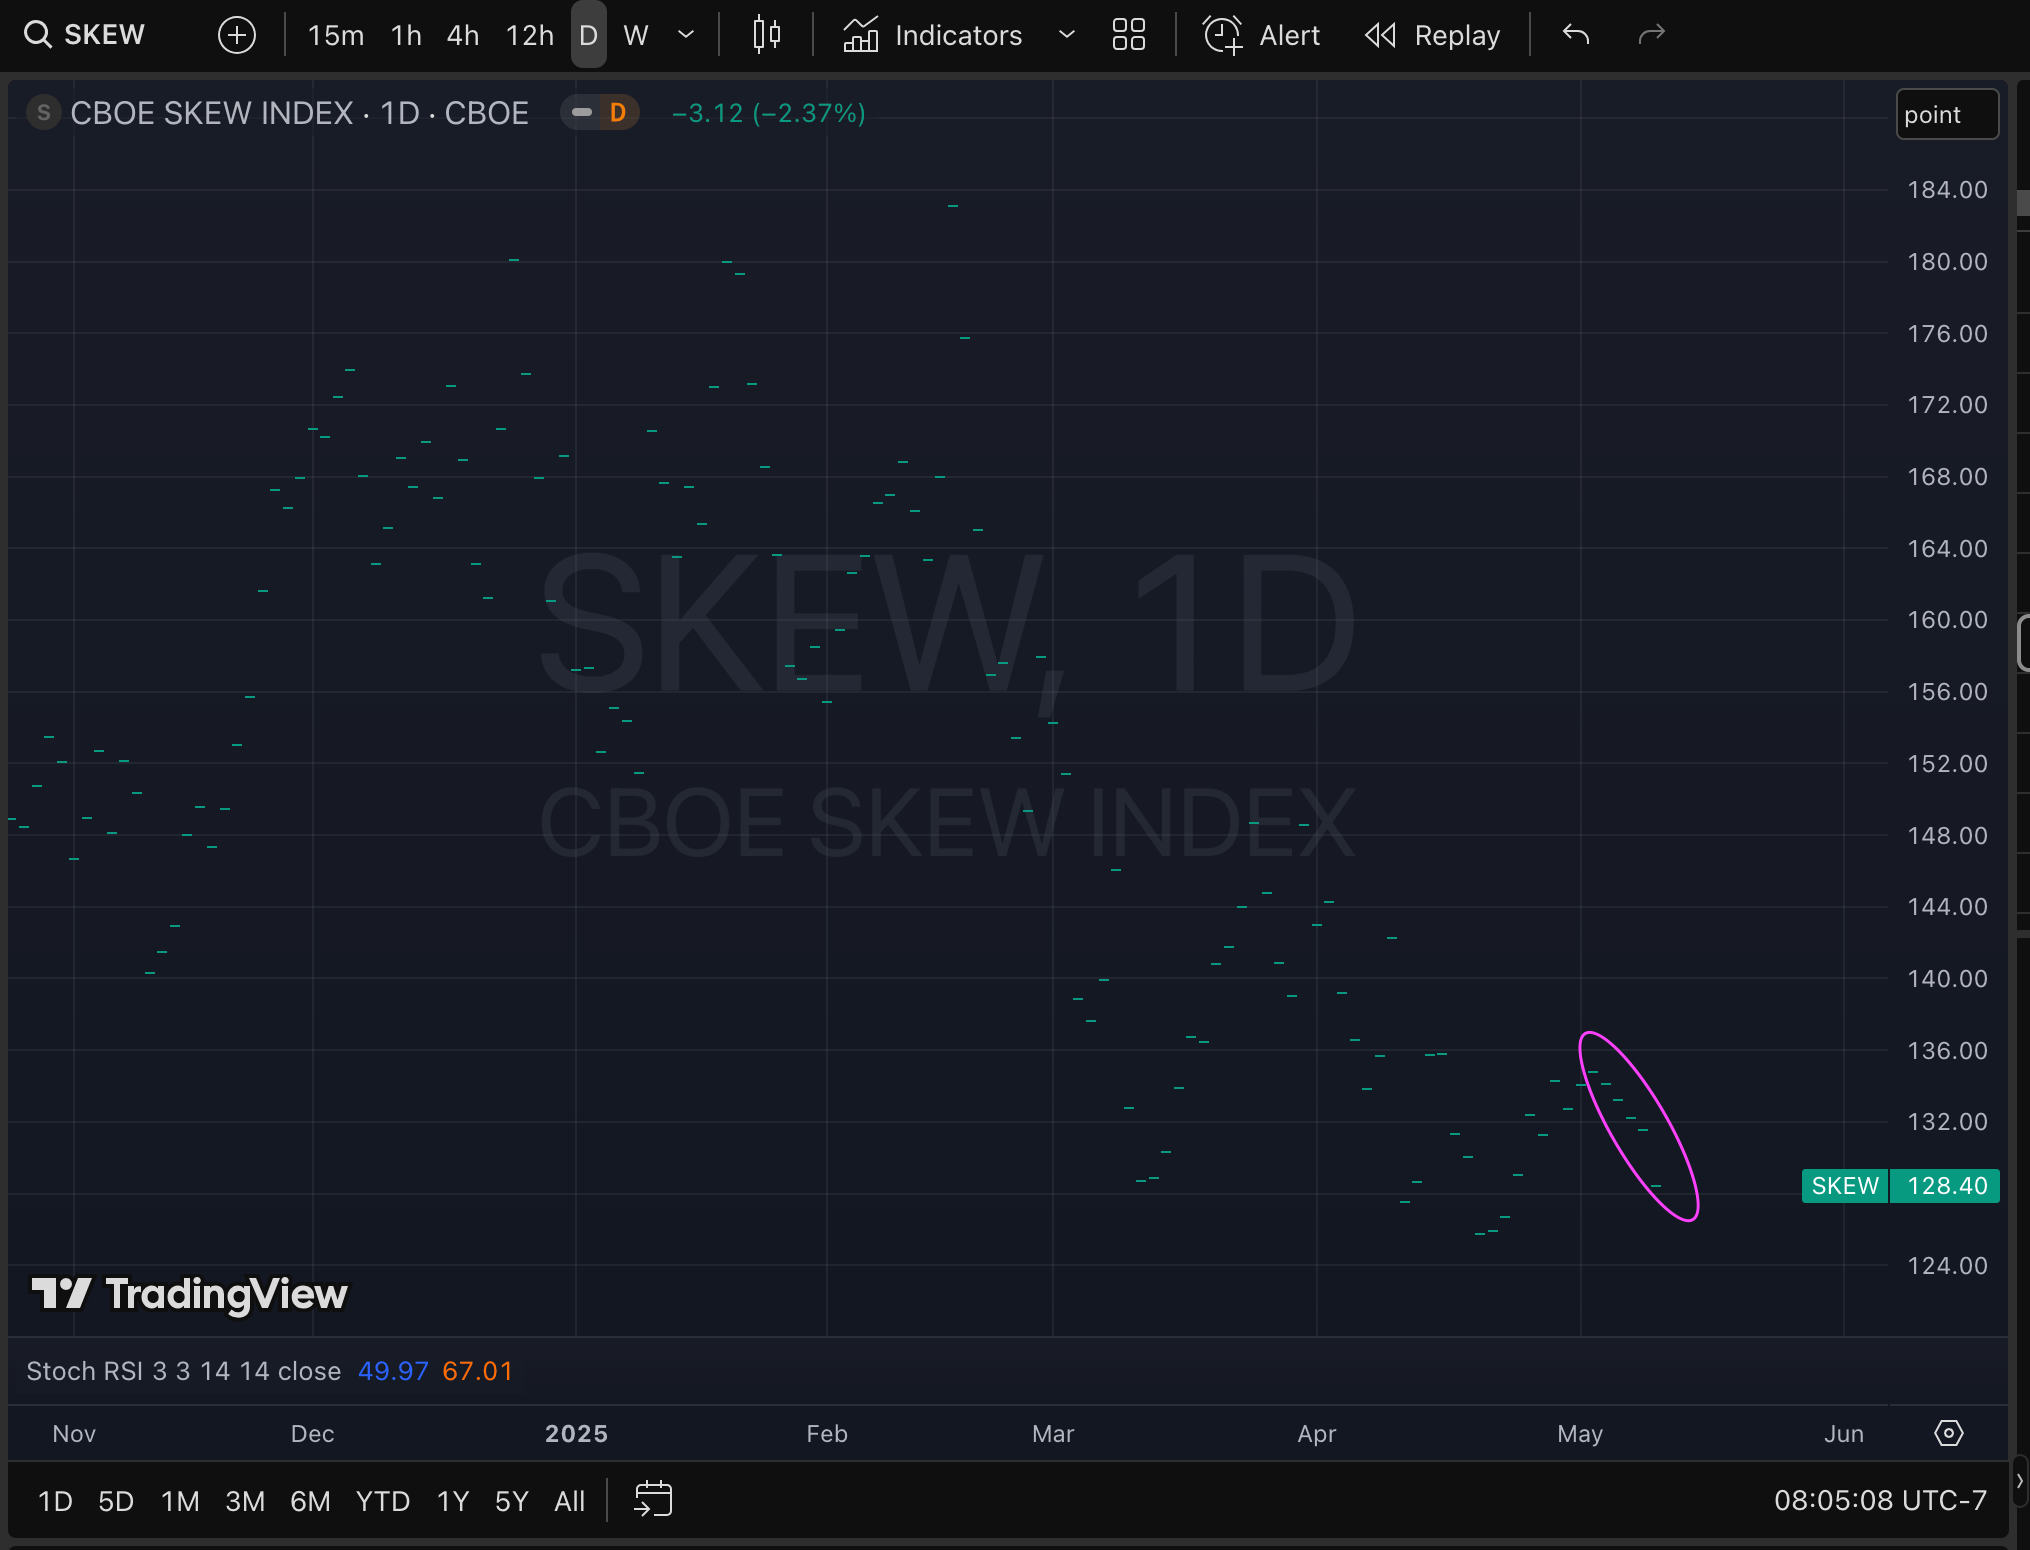
CBOE SKEW is based on the implied volatility of out-of-the-money strikes over the next 30 days out. It is somewhat of a proxy for what the market attributes to the probability of a 2-3 standard deviation move on the S&P 500 over the next 30 days - tail risk in other words. Historically, a decreasing SKEW has preceded selloffs (sometimes its just concurrent). So I ask myself, why has SKEW been decreasing for 5 days straight? To me the impact is bearish - rating 2/5.
Volatility
At the moment, future volatility (VVIX) has decreased considerably.
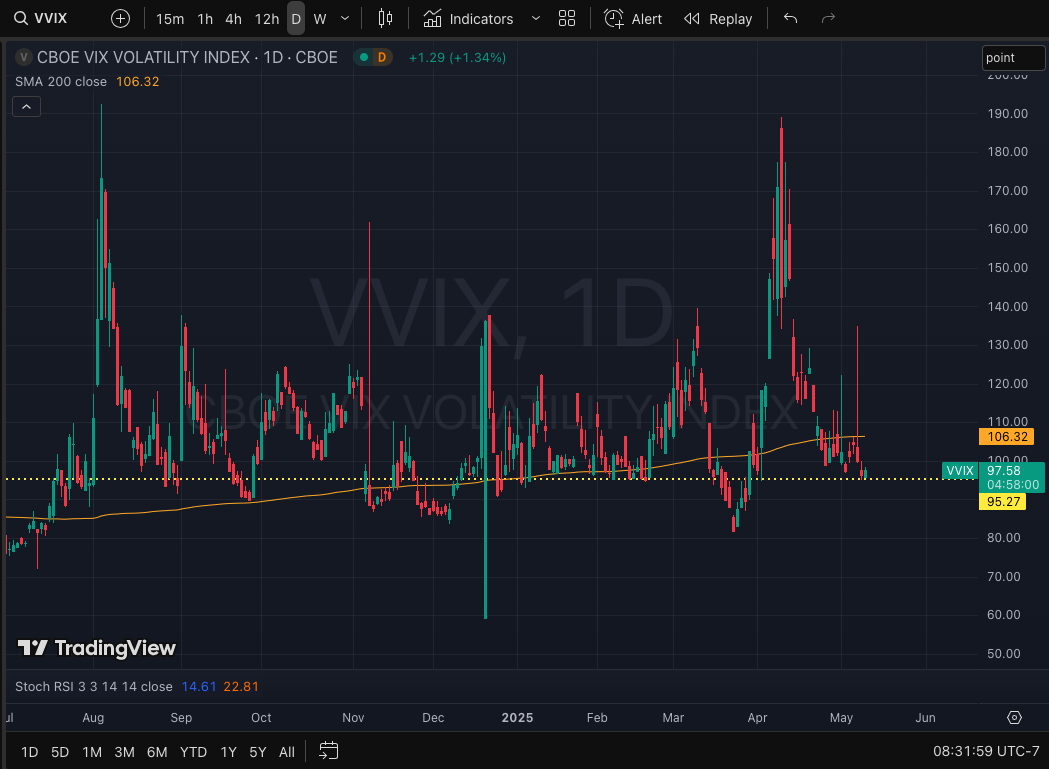
We can also see this in the the VIX term structure which is showing almost a flat structure now. Current vol is still very elevated compared to January and February but much less so than March and April was. Combined this shows a transitory period in market sentiment. Many CTAs (Commodity Trading Advisors) and vol-targeting funds adjust their exposure based on volatility. Lower vol triggers buying (mechanical re-risking), especially from vol-control and risk-parity strategies and CTA’s. This is what is referred to as mechanical buying of the index.

We can see that front month VIX futures are still very elevated. So, either volatility is priced too high or the index is priced too high. Both cannot be true at the same time without one of them correcting. There seems to be more room for volatility to sell. The impact to me is neutral/bullish - rating 3.5/5.

Technicals
I’m using QQQ in this example because price action is more obvious but SPX is not far behind. Market seems to be hugging the 200-day SMA. One case where this happened was 2018. This is not bearish in itself but if it continues to struggle here it could imply another trip down unless we gap up and continue past this ‘resistance’. Impact is neutral - rating 3/5.

Other
Some less quantitative (or less real-time) metrics that I want to note are:
Buyback season is here now that earnings are concluding. Buybacks will continue for several weeks/months. Impact from this is bullish - rating 4/5. Note that the peak of buyback season also coincides with tops in markets.
CTA’s and hedge funds are still net bearish and have some ‘catch up’ buying to do. Impact from this is bullish - rating 4/5.
Overall Metrics
I’m sharing my mental dashboard with you of what I think are important metrics. I attribute a total rating of 23.5 / 40. This is neutral near-term. My hedges have been relatively small for now. You will know when the hedges become more sizeable. Maybe not as obvious as the post below but the time will come again.
Review of Hedging Activity
May puts have lost most of their value now, unfortunately, for the reasons mentioned above (index up 120 pts, loss due to theta). June puts are still ok. Here was the last point I added to June hedges.
Review of Long Setup (MES futures)
I’m still in 1/3 of the MES long futures from 04/21 (the high risk trade at 5115 on SP500) and more so using it now to track what the index is doing for the past few weeks.
Help others by sharing this publication if you find this information useful. See you in the chat.
Disclaimer
This Substack serves as a personal journal for my own reference and is not intended as financial or investment advice. The content is purely informational and reflects my personal observations, not recommendations.
I am not a registered financial advisor, and nothing here should be considered professional guidance. Investing, especially in securities and options, involves substantial risk, and past performance does not guarantee future results.
By reading this Substack, you acknowledge that all trading decisions are solely your responsibility, and I am not liable for any financial outcomes resulting from your actions.